
Absolute Return vs CAGR vs XIRR: Stop Picking the Wrong Number

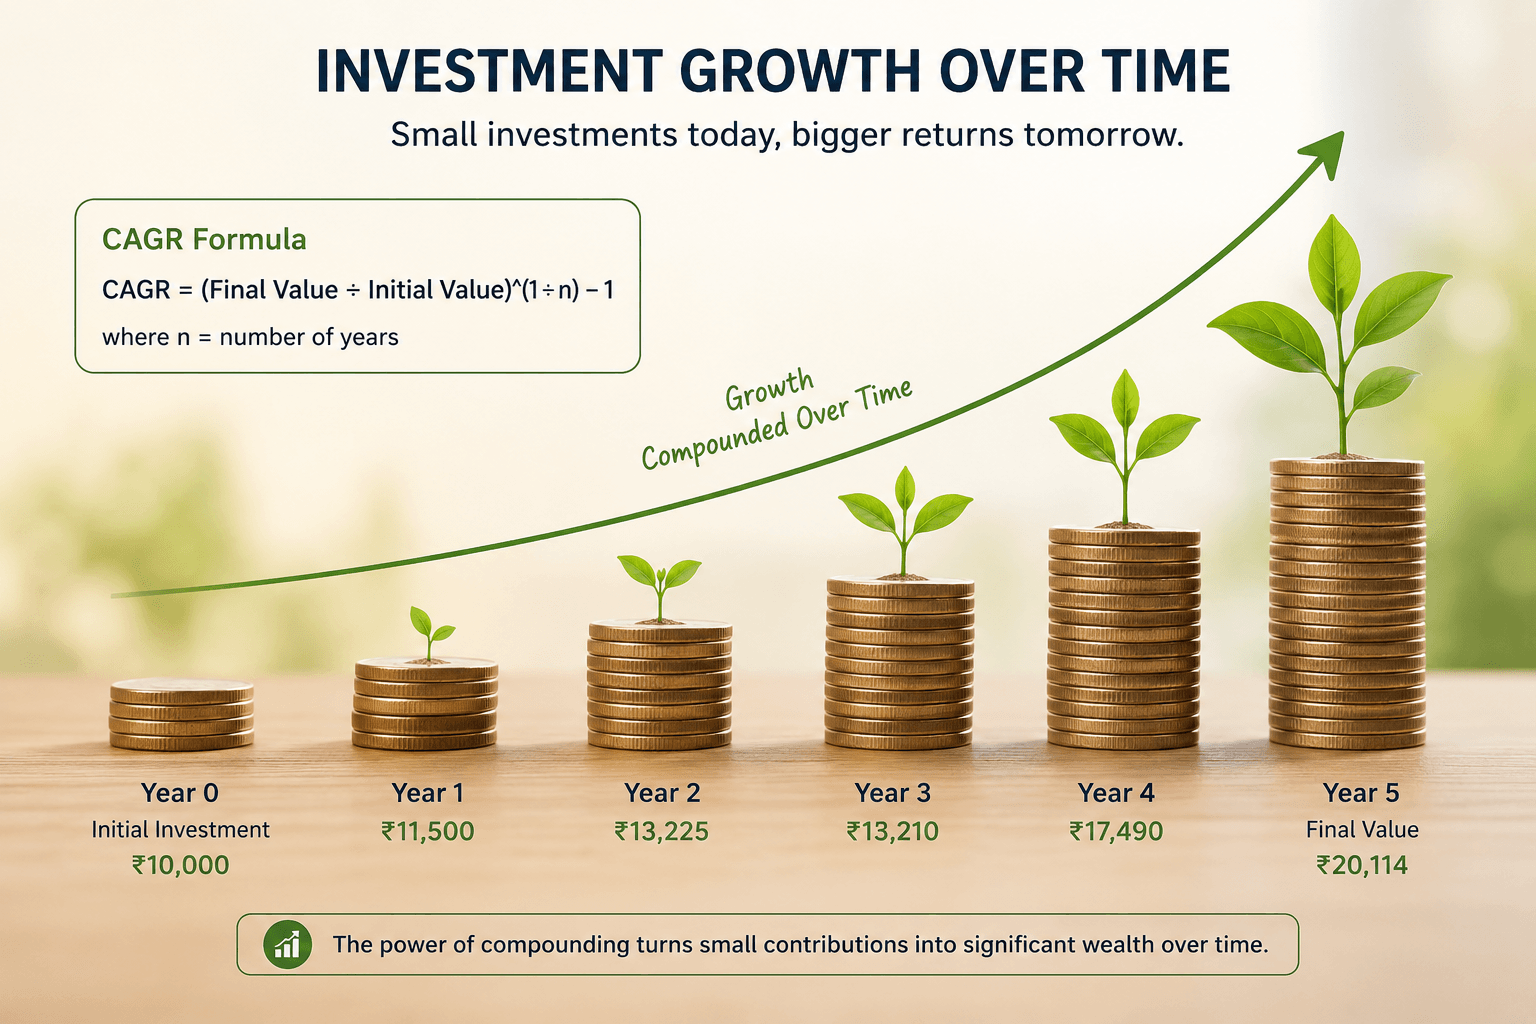
Most people pick the return metric that makes their investment look best. That’s the actual problem.
When your mutual fund app shows a 40% return, is that over 2 years or 5 years? Is it a lump sum or a SIP? Does that number account for the timing of each installment? The answer to all three changes the meaning of ‘40%’ completely — and yet most investors never ask.
Absolute return, CAGR, and XIRR each measure something real. But they each measure a different thing, for a different situation. Use the wrong one and you’ll either feel great about a mediocre fund or worry unnecessarily about a perfectly good one.
Here’s exactly how each works — with numbers.
What This Article Covers
What Absolute Return Tells You — And Where It Falls Apart
The formula is about as simple as finance gets:
Absolute Return = ((Current Value − Amount Invested) ÷ Amount Invested) × 100
If you invested ₹1,00,000 as a lump sum and it’s now worth ₹1,30,000, your absolute return is 30%. That’s it. No time period involved. No compounding.
That’s also exactly why it breaks down fast.
Imagine two investors meeting at a wedding:
- Ananya: “My fund gave me 30% returns.”
- Vikram: “Mine too — 30%!”
Ananya held for 8 months. Vikram held for 5 years.
Same number. Completely different performance.
Ananya’s 30% in 8 months would be exceptional. Vikram’s 30% over 5 years works out to roughly 5.4% per year — barely keeping up with inflation, and worse than most fixed deposits.
Absolute return hides the time dimension. And time is arguably the most important variable in any investment.
This is why the Securities and Exchange Board of India (SEBI)’s Master Circular for Mutual Funds (Cir/IMD/DF/13/2011) requires mutual fund advertisements and fact sheets to report performance as CAGR for any scheme with more than 12 months of history. Below 12 months, absolute return is the standard — and it genuinely is the right tool there, because annualising a very short period can produce misleadingly large percentages.
Use absolute return only for investments held under one year. For anything longer, you need CAGR.
What CAGR Actually Measures (With a ₹ Example That Makes It Click)
Compound Annual Growth Rate (CAGR) takes the total growth and smooths it into an equivalent annual rate — as if your investment grew at the same pace every single year.
The market doesn’t actually do that, of course. A fund might give 35% one year, crash 20% the next, and deliver 18% the year after. CAGR smooths all of that into one honest average annual rate that would produce the same final outcome.
Formula: CAGR = (Final Value ÷ Initial Value)(1 ÷ n) − 1 (where n = number of years held)
Example: Deepak’s Mid-Cap Fund
Deepak invested ₹2,00,000 in a mid-cap fund (lump sum) on 1 January 2019. By 1 January 2024 — exactly 5 years later — it’s worth ₹4,50,000.
- Absolute return: 125%
- CAGR: (4,50,000 ÷ 2,00,000)^(1/5) − 1 = (2.25)^0.2 − 1 ≈ 17.6% per year
That 125% sounds like a windfall. The 17.6% annual CAGR tells you it’s a strong equity fund return — and that framing lets you compare it against any other investment.
Why CAGR Is the Standard for Comparisons
Suppose Deepak’s colleague Smita put ₹2,00,000 into a different fund in January 2017, and it reached ₹5,40,000 by January 2024 — 7 years later. Her absolute return: 170%. Higher. Clearly better, right?
Not so fast:
- Smita’s CAGR: (5,40,000 ÷ 2,00,000)^(1/7) − 1 = (2.7)^0.143 − 1 ≈ 15.3% per year
- Deepak’s CAGR: 17.6% per year
Deepak’s fund outperformed Smita’s, even though her absolute return was higher. The extra 2 years inflated her total gain without reflecting a faster growth rate. CAGR sees through that.
When to Use CAGR
- You made a single lump-sum investment on one date
- Your holding period exceeds 12 months
- You want to compare two investments with different timelines
- You’re benchmarking your fund against the Nifty 50 or any index
What CAGR cannot do: It assumes a single entry date. The instant you have two or more investment dates — a SIP, an additional lump sum, a partial redemption — CAGR gives you a distorted picture. For that, you need XIRR.
What XIRR Is — And Why It’s the Only Honest Number for SIP Investors
Extended Internal Rate of Return (XIRR) is the return metric designed for the way most Indians actually invest: monthly SIPs, occasional top-ups, maybe a partial withdrawal or two along the way.
It accounts for the exact date and exact amount of every transaction. Every SIP instalment you put in on a different date is treated differently — because it should be. Your January 2022 SIP has been compounding for longer than your January 2025 SIP. XIRR knows this. CAGR doesn’t.
Technically, what XIRR calculates: It finds the single annualised rate of return that makes the net present value (NPV) of all your cash flows equal to zero — where each outflow is weighted by how long ago it happened. The math requires iteration and cannot be done by hand, which is why Excel has a dedicated =XIRR() function for it.
Example: Meera’s 2-Year SIP
Meera started a ₹5,000/month SIP on 10 January 2023 in a large-cap index fund. She ran it for exactly 2 years — 24 instalments — until 10 December 2024. Total invested: ₹1,20,000.
On 10 January 2025, her portfolio is valued at ₹1,45,500.
- Absolute return: (1,45,500 − 1,20,000) ÷ 1,20,000 × 100 = 21.25%
- CAGR: Not applicable here (multiple investment dates across 2 years)
- XIRR: approximately 18.5% per annum (calculated using Excel’s =XIRR function, with each SIP date as a separate cash flow and the portfolio value as a final positive entry)
The absolute return of 21.25% sounds decent but it’s measuring apples and oranges — it divides a gain from 24 different investment dates as if it were one single lump sum. XIRR gives you the honest annual rate.
And that 18.5% XIRR is a number you can actually use: compare it to a PPF’s 7.1%, a fixed deposit’s 7–7.5%, or the CAGR of a lump-sum investor in the same fund over the same period.
Bonus: When You Partially Redeem
Suppose Meera also withdrew ₹20,000 from this fund in July 2024 for a short-term expense. CAGR and absolute return have no way to handle this cleanly. XIRR handles it perfectly — you simply add that withdrawal as a positive cash flow entry on the date it happened, and the formula adjusts.
This is why the Association of Mutual Funds in India (AMFI)’s investor guidance and every serious portfolio tracking tool in India uses XIRR as the standard for personal SIP performance reporting.
Absolute Return vs CAGR vs XIRR: A Quick Comparison
| Absolute Return | CAGR | XIRR | |
| Best for | Lump sum held under 1 year | Lump sum held over 1 year | SIPs, multiple investments, partial redemptions |
| Accounts for time? | No | Yes (fixed period) | Yes (each transaction dated) |
| Handles multiple cash flows? | No | No | Yes |
| Formula complexity | Simple subtraction | Moderate (power formula) | Requires Excel or tool |
| SEBI mandated for funds | Under 12 months | Over 12 months | Used in individual CAS reporting |
| Where you’ll see it | Short-term fund ads; liquid fund returns | AMC fact sheets; fund comparison sites | CAS from CAMS/KFintech; Kuvera; MFCentral |
| Risk of misuse | High — hides holding period | Medium — breaks for SIPs | Low — but needs Excel/app |
The Three Mistakes That Give You a False Picture of Returns
Mistake 1: Using Absolute Return to Judge Long-Term Investments
A fund that ‘gave 150% returns’ is saying almost nothing. ₹1,00,000 becoming ₹2,50,000 over 12 years is a CAGR of just 7.9% per year — worse than a PPF, which has offered 7.1% and been entirely tax-free. Over 6 years, the same ₹1,00,000 becoming ₹2,50,000 gives a CAGR of 16.5% — a solid equity return.
Same 150% absolute return. One is a disappointment; one is solid performance. Always convert to CAGR.
Mistake 2: Running CAGR on Your SIP Total
This is extremely common. You’ve invested ₹6,00,000 over 5 years via SIP, and the portfolio is now ₹8,50,000. Someone takes (8,50,000 ÷ 6,00,000)^(1/5) − 1 and calls it the fund’s CAGR. The problem: that formula assumes all ₹6,00,000 went in on day one. It didn’t. The last ₹5,000 went in last month. Treating five years’ worth of staggered SIPs as a single lump sum gives you a wrong number.
Use XIRR. Always.
Mistake 3: Comparing CAGRs Across Different Time Windows
“My fund gave 21% CAGR in 3 years; my friend’s fund gave 14% CAGR in 5 years — mine is clearly better.”
Maybe. Or maybe your 3-year window captured the post-COVID recovery rally of 2020–2023, when almost every equity fund looked like a genius. Your friend’s 5-year window started before a crash and compounded through more representative market conditions.
Time windows are not interchangeable. For a fair comparison, use the same period, or use rolling returns — a technique where CAGR is calculated across many overlapping time windows (for example, every possible 5-year period over the last 15 years). Most fund research sites like Value Research display this, giving you a much more reliable picture of consistency.
How to Find Your XIRR in Under 5 Minutes
Option 1: Download Your CAS (Easiest and Most Accurate)
Your Consolidated Account Statement (CAS) is a free official document issued by CAMS and KFintech — the two Registrar and Transfer Agents (RTAs) who maintain all mutual fund records in India — and it shows every transaction across all your folios, with exact dates and amounts.
- Go to camsonline.com (CAMS) or mfs.kfintech.com (KFintech)
- Request a ‘Detailed’ statement — not the summary; you need the full transaction history
- Enter your registered email address; select ‘Since Inception’ for complete data
- The PDF arrives in minutes, password-protected with your PAN in uppercase (e.g., ABCDE1234F)
The detailed CAS shows your XIRR per fund and total XIRR for your entire portfolio. This is the official, accurate number.
Option 2: Calculate It Yourself in Excel
- In column A, list every SIP or investment date. In the last row, add today’s date.
- In column B, enter each SIP amount as a negative number (money leaving your account). In the last row, enter your current portfolio value as a positive number.
- In any empty cell, type: =XIRR(B1:Bn, A1:An) — adjust the range to match your data.
- Hit Enter. That percentage is your XIRR. Google Sheets has the identical function.
Option 3: Use MFCentral (No Download Needed)
MFCentral (mfcentral.com), operated jointly by CAMS and KFintech, lets you log in with your PAN and OTP on your registered mobile. It pulls all your folios across all fund houses and shows consolidated XIRR. Free, no Excel required.
What’s a Good XIRR? A Reality Check for Indian Investors
Based on historical long-term data from AMFI and independent fund research, here are reasonable XIRR ranges for 5-year SIPs. These are not guarantees — they reflect historical performance patterns and will vary based on market conditions and fund selection.
| Fund Category | Reasonable XIRR Range (5-Year SIP, Historical Patterns) |
| Large-cap index fund (Nifty 50 / Sensex) | 10-14% per annum |
| Flexi-cap / large & mid-cap fund | 12-16% per annum |
| Mid-cap fund | 13-18% per annum |
| Small-cap fund | 12-20% per annum (high variance) |
| Hybrid / balanced advantage fund | 9-13% per annum |
If your XIRR on a large-cap fund after 5 years sits at 8%, it’s time to review whether you’re in the right fund. If it’s 18% on the same category, you’ve had a particularly strong run — don’t extrapolate it forward.
Important caveat: a SIP that’s less than 12–18 months old will show XIRR heavily influenced by recent market swings. Don’t draw conclusions from it yet. Give it at least 3 years before using it as a basis for fund decisions.
What to Do This Week
- Download your CAS from CAMS or KFintech (free). Request a ‘Detailed’ statement since inception. Password is your PAN in uppercase. Takes about 5 minutes.
- Check the XIRR column in your CAS for each fund. Compare against the ranges in the table above for your fund category.
- For any lump-sum investments, calculate CAGR manually: (Final Value ÷ Initial Value)^(1/n) − 1. Takes 2 minutes in any calculator.
- Stop quoting absolute return on long-term holdings. It’s the most common way investors either overstate or understate their real performance.
- For your next fund comparison, always use CAGR for the same time period — not whatever figure happens to look best for each fund separately.
- If your XIRR is below 10% on an equity SIP held over 3 years, compare it against the Nifty 50’s CAGR for the same period (available free on AMFI’s website). If the index beat you by more than 2%, consider whether you’d be better off in a low-cost index fund.
Related Reading on The Salary Investor
- SIP vs Lump Sum: Which Strategy Actually Makes More Money
- Step-Up SIP: The Smartest Way to Invest When Your Salary Grows Every Year
- What Is Expense Ratio in Mutual Funds and Why It Silently Eats Your Returns
- Dividend vs Growth Option in Mutual Funds: Which One Should You Actually Pick?
- Capital Gains Tax in India: The Complete Guide to STCG and LTCG
Disclaimer: Data and return benchmarks referenced in this article are based on publicly available historical information as of June 2026. Mutual fund investments are subject to market risk and returns are not guaranteed; past performance does not indicate future results. This article is for general financial education only and does not constitute investment advice. Please consult a SEBI-registered investment advisor or a Chartered Accountant before making any investment decisions.
Sources: SEBI Master Circular for Mutual Funds (Cir/IMD/DF/13/2011), August 2011 — sebi.gov.in * AMFI Investor Corner — amfiindia.com * AMFI Best Practices Circular No. AMFI/CU148/109, November 2023 — amfiindia.com * Zerodha Varsity — Measuring Mutual Fund Returns — zerodha.com * CAMS Consolidated Account Statement — camsonline.com * KFintech Consolidated Account Statement — mfs.kfintech.com * AMFI Mutual Fund Industry Data, June 2025 — amfiindia.com

He figured out most of what he knows about personal finance not from courses or advisors, but from years of reading, making mistakes, and fixing them. The Salary Investor is his attempt to save other salaried Indians the same time and money.
He is not a CA or a SEBI-registered advisor. He writes as a fellow salaried person who has been in the trenches — navigating EPF, ITR, 80C, salary slips, and market volatility.
- Gratuity Before 5 Years: The Legal Reality vs What HR Tells You - September 20, 2026
- ESOP Taxation in India 2026: When You’re Taxed, How Much, and What to Do at Each Stage - August 20, 2026
- How to Claim HRA Exemption If You Pay Rent to Parents — The Complete Legal Guide - August 16, 2026